Section 1: Q3 2020 Outlook
A Crisis Like No Other: Recovery in A Changed World
The global economy is in its worst downturn since the 1930s. For the first time, all regions are projected to experience negative growth in 2020. There are, however, substantial differences across individual economies, reflecting the evolution of the pandemic and the effectiveness of containment strategies: variations in economic structure (dependence on severely affected sectors, such as tourism and oil), reliance on external financial flows, and pre-crisis growth trends. As we review and look forward in this Third Quarter 2020 Outlook, we are forecasting a recession in the U.S. and most of the globe that will extend beyond our twelve-month time horizon. Our approach to portfolio management is nimble, opportunistic, and deliberate in identifying asset classes that are best placed to generate returns in a new world order. Our focus is on protecting portfolios from downside risk, and we believe that our investment process is working to achieve that goal.
The impact of COVID-19 on the global economy is deeper and longer than initially expected. Economic data available at the time of the April 2020 International Monetary Fund World Economic Outlook forecasted an unprecedented decline in global activity due to the COVID-19 pandemic. Data releases since then suggest even deeper downturns than previously projected for several economies. Economic activity remains suppressed due to concerns of multiple waves and global economic output is not forecasted to return to pre-pandemic levels until 2023, led by emerging markets. The IMF projects recovery to be much slower for advanced economies, which are not expected to exceed 2019 real GDP levels until 2026.
The World Trade Organization 2020 forecast estimates that the volume of global merchandise trade will decline by between 13 and 32 per cent compared to the previous year. They expect central banks to keep interest rates low, and in many countries negative, while credit spreads will remain elevated through to 2024. Global growth is projected at negative 4.9 percent in 2020. The COVID-19 pandemic has had a more negative impact on activity in the first half of 2020 than anticipated, and the recovery is projected to be more gradual than previously forecast. In 2021, the WTO projected global growth at 5.4 percent, leaving 2021 GDP 6.5 percentage points lower than in the pre-COVID-19 projections of January 2020.
We expect monetary and fiscal policy to remain strongly supportive with most governments able to sustain higher debt loads without the need for severe austerity. The adverse impact on low-income households is particularly acute, undoing the progress made in reducing extreme poverty in the world since the 1990s. Synchronized deep downturns are foreseen in the United States (–8.0 percent), Japan (–5.8 percent), the United Kingdom (–10.2 percent), Germany (–7.8 percent), France (–12.5 percent), and Italy and Spain (–12.8 percent). In 2021, the IMF projected the advanced economy growth rate to strengthen to 4.8 percent, leaving 2021 GDP for the group about 4 percent below its 2019 level.
The downward revision to growth prospects for emerging market and developing economies over 2020–21 (2.8 percentage points) exceeds the revision for advanced economies (1.8 percentage points). Excluding China, the downward revision for emerging market and developing economies over 2020–21 is 3.6 percentage points.i
The steep decline in activity comes with a catastrophic hit to the global labor market. Some countries (notably Europe) have contained the fallout with effective short-term work schemes. According to the International Labor Organization, the global decline in work hours in 2020 Q1 compared to 2019 Q4 was equivalent to the loss of 130 million full-time jobs. The decline in 2020 Q2 is likely to be equivalent to more than 300 million full-time jobs.ii Where economies have been reopening, activity may have troughed in April, as suggested by the May employment report for the United States, where furloughed workers are returning to work in some of the sectors most affected by the lockdown.
The synchronized nature of the downturn has amplified disruptions around the globe. The WTO reported that global trade contracted by close to –3.5 percent (year over year) in the first quarter, reflecting weak demand, the collapse in cross-border tourism, and supply dislocations related to shutdowns (exacerbated by trade restrictions). This underscores why international cooperation to keep global markets open for goods and services is more important than ever.
The pandemic is creating a sharp rise in corporate, government, and individual debt. We see four options to deal with this debt: Default, Austerity, Inflation, and Living with the Extra Debt.
Here we review Austerity, Inflation and Living with the Extra Debt. We will defer a review of the Default option until a point in time when we believe it is viable.
1. Austerity and The Paradox of Thrift
The term austerity is taken to mean any measure (i.e. tax rises as well as spending cuts) taken to reduce the structural budget deficit. The prospect of tax increases and government spending cuts to pay for the big fiscal packages that governments have launched to see their countries through the coronavirus crisis will result in austerity that will burden the recovery when lockdowns are eased. The coronavirus will result in a sharp rise in government debt as larger deficits and a deterioration in the trajectory of the debt ratio occur. Some governments are running significant primary budget deficits as the coronavirus results in a rise in health spending and an expanded role for the state more generally. This comes as many countries already face rising spending related to the ageing population.
The impact of austerity depends on the types of tax rises/spending cuts that are introduced and the circumstances at the time. Cuts in day-to-day spending would be less damaging to the economy’s supply potential than the cuts in public sector investment or incentive-blunting tax rises that formed part of the post-financial crisis austerity drive. In addition, there needs to be scope for monetary policy to loosen to compensate. Unfortunately, central banks have depleted their toolboxes. It is most effective when a country is undertaking austerity in isolation, as strong net exports can potentially help to offset the impact on demand.
The Paradox of Thrift was popularized by the renowned economist John Maynard Keynes. It states that individuals try to save more during an economic recession, which essentially leads to a fall in aggregate demand and hence in economic growth. Such a situation is harmful for everybody as investments give lower returns than normal. Scars from the crisis will alter spending behavior for years. Bloomberg Economics has forecast that personal savings rates will settle in around 3 to 4 percentage points above the pre-crisis level of around 8%, a drain of 1% annually in GDP growth. That is $200 billion of forgone spending per year. The paradox of thrift is causing chaos for the traditional retail sector as Brooks Brothers (founded in 1818) files for bankruptcy (following Neiman Marcus, J.C. Penney and J. Crew Group). Other retailers are closing outlets as well (Bed Bath & Beyond is saying it will permanently shutter 200 of its 1,500 stores).
With elections pending around the globe, there will be voter resistance to more spending cuts. The coronavirus crisis will lead to pressure for governments to spend more, not less, with demands for increases in funding for health services and greater welfare spending. Most countries are unlikely to contemplate government austerity before their economies are fully recovered but recovery will be impeded due to austerity among their citizens.
2. Deflation in the Short-Term: Inflation in the Long-Term
The unprecedented monetary and fiscal measures implemented around the world are expected lead to weaker long-term growth and currency debasement. The risk of a surge in inflation is nil in 2020 and 2021 as the disinflationary effects of weaker demand outweigh any supply shortages over our twelve-month forecast time horizon. Average inflation in advanced economies has dropped about 1.3 percentage points since the end of 2019, to 0.4 percent (year over year) as of April 2020, while in emerging market economies it has fallen 1.2 percentage points, to 4.2 percent.iii
Inflation Is the Price to Be Paid
The 25% year-over-year surge in M2 growth has not resulted in inflation. This is explained by the Quantity Theory of Money: MV = PY, where “M” is the money stock, “V” is money velocity (the turnover rate), “P” is the price level and “Y” is the real level of output. Both sides must equal each other. The problem is that money velocity is contracting to a record low, and at a record rate, with a decline of 27% on a year-over-year basis, overtaking the run-up in the money supply.iv
Massive policy stimulus has raised inflation risks for the future when demand does recover.
Policymakers will need to deal with any rise in inflation resulting from the permanent rise in the money supply by imposing controls on lending or raising interest rates. Such measures will impose costs on the economy and the financial system. A rise in inflation would push up borrowing costs, making it more expensive to finance deficits and refinance maturing debt. There would be an initial drop in the debt ratio, given that most government debt does not mature in the short-term, but the average maturity of government debt is not exclusively long.
To avoid this, governments will need to use the bond market, either by monetizing the debt and/or by financial repression (i.e. forcing the private sector to buy debt at below market prices).
Debt Monetization
Major economies have not yet reached the stage of debt monetization. There is no formal, universally agreed upon definition of debt monetization but there are two defining characteristics that make it distinct from central banks’ purchases of government bonds through asset purchase programs like quantitative easing (QE). The first is that it involves the central bank funding the government directly, rather than just buying its debt in the secondary market. The second is that it is permanent rather than temporary.
So far in this crisis, many central banks have bought government debt in the secondary market via their asset purchase programs. When the central bank buys bonds in the secondary market, it generally does so to meet its own objectives such as maintaining the functioning of financial markets or meeting its inflation target.
Only a few central banks have funded their government directly. This occurs when the central bank buys new bonds straight from the government either directly or in auctions (the primary market), or by doing away with government bonds altogether and the central bank simply handing money to the government. The Indonesian central bank (which is buying government debt at auction) and the Philippines central bank (which has bought debt directly from the government under a three-month repo agreement) have done this. Although the Bank of England extended a direct loan to the UK Treasury under the Ways and Means facility, this was essentially just a bridging loan.v
Financial Repression
More recently, financial repression has tended to take the form of quantitative easing (QE) or more stringent requirements for banks to hold low-risk assets including government bonds. QE has brought the added benefit that the government is just paying the interest to itself on a portion of its debt. Financial repression also describes measures by which governments channel funds from the private sector to themselves as a form of debt reduction. The overall policy actions result in the government being able to borrow at extremely low interest rates, obtaining low-cost funding for government expenditures.
Raising inflation through large amounts of QE would risk inflating another asset price bubble which, when it burst, could prompt another financial and economic crisis. High inflation could also hurt real economic growth. This would also lessen the drop in the debt to GDP ratio. Bringing inflation back down again would require a sharp slowdown in the real economy. Governments could choose to live with high inflation once the debt burden had been reduced, but this would also inflict significant long-term damage on the economy, by reducing investment and distorting price signals, distorting asset prices. When inflation has been used to reduce debt in the past, it has usually happened because a government has resorted to this out of desperation and weakness, rather than because it has judged that it is in the best interests of the economy in the long term. This is negative for the dollar and positive for precious metals.
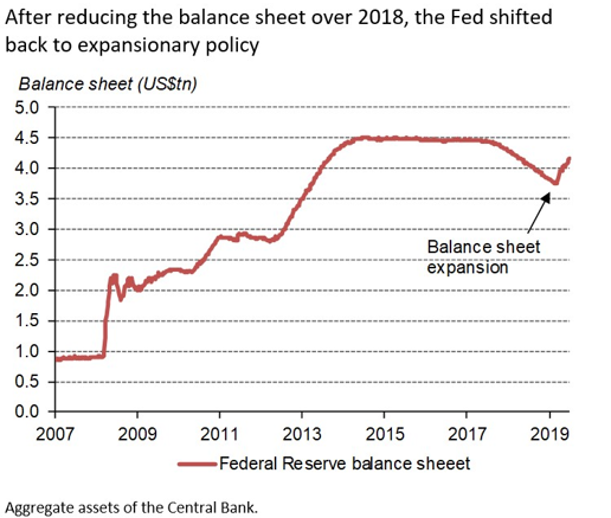
The current situation in which asset purchase programs are facilitating fiscal expansions are having the same macro-economic effects as debt monetization. While direct financing is likely to be done with the sole intent of funding government spending, under recent asset purchase programs there is a blurring of the line between central banks and governments. Some central banks (including the U.S. Fed) have abandoned quantitative constraints on the amount of their asset purchases. When the debt held by the central bank is not sold back to the market, the government never has to repay the money given to it by the central bank. This equates to a form of so-called “helicopter drop”, meaning that government debt never rises. The permanent rise in the money supply might be reversed in the future as central banks sought to reverse the resulting inflation pressures while the current temporary asset purchase programs might never be reversed and become debt monetization after all.
3. Living With Debt
In China, where the recovery from the sharp contraction in the first quarter is underway, growth is projected at 1.0 percent in 2020, supported in part by policy stimulus. Much of the economy already appears to be growing again in year-on-year terms. Significant infrastructure-focused stimulus is now being rolled out.
In countries where the dynamics are less favorable, they will have to reduce debt in one of the other potentially more painful ways. Before the coronavirus struck with interest rates so low, government debt in many countries was expected to rise further while still being sustainable in the long run. When interest rates are lower than GDP growth, debt will rise at a slower rate than GDP and, over time, the debt to GDP ratio will shrink. This is sustainable. In most developed economies and many emerging markets, nominal interest rates have been lower than nominal GDP growth. Countries where interest rates are lower than GDP growth will be able to run a primary deficit, while ensuring that debt as a share of GDP is falling. This hinges on governments keeping their primary budget deficits low. This ensures that the overall deficit (rather than just debt servicing costs) increase at a slower rate than GDP.
When we look at a comparison of total debt to GDP, Canada’s 350% ratio compares to 330% in the U.S. Fitch cut Canada’s AAA rating down to AA+ in June, citing a “deterioration in Canada’s public finances.” Italy’s debt ratio is 360% and its credit rating is BBB. Greece is 340% and it is rated BB-. Spain’s debt ratio is 360% and it has a BBB- ranking. China is at 290% and has an A+ rating by S&P.vi
In the past half-decade, the growth in corporate debt has outstripped the profits to service the debt by a factor of nearly five. Debt-to-equity ratios of 40%, as they stand, were at eight-year highs going into this recession, the same level as in the first quarter of the credit crisis in 2008.
Corporations across the globe tapped bond markets for $384 billion from January to May, resulting for the entire year in an extra $1 trillion of liabilities that are now added to already strained balance sheets. The Fed-led bailouts of impaired companies is, for the third cycle in a row, happening in a recession that is made worse by too much debt being fought with even more debt. Firms with below investment grade or junk credit ratings have been able to float a record $48 billion in new bonds in June, because of the Fed’s program support. For investment grade companies, from March to May, they issued more than $230 billion of new debt.vii Both the federal government and the corporate sector come out of this pandemic with crippled balance sheets. Unfortunately, the corporate sector is in much worse shape as the federal government has taxing authority while companies do not.
When the pandemic struck, governments around the world opened up the fiscal taps in an attempt to limit the human suffering from the necessary lockdowns. Before the coronavirus, support was growing for the idea that many governments could cope with higher levels of debt. This reflected the fact that in most developed markets, as well as many emerging markets, nominal interest rates are below the rate of nominal GDP growth. This implies that, as long as a government is not running big primary budget deficits, the debt to GDP ratio can erode over time. However, the current recession has been made worse by overextended private and public sector balance sheets that were run up during the expansion that was underway prior to the pandemic. That overhang constrained economic growth to the point that the last expansion was the weakest on record and cleaning up the pile of debt will impede future growth, even once we are past this health crisis.
The Bruegel think tank has compiled the cumulative fiscal responses by major European economies and the United States. Their summary breaks the efforts down into three categories: (1) direct fiscal response, (2) tax deferrals, and (3) other liquidity provisions and guarantees. Given the uncertainty about the 2020 GDP forecast, the sizes of the stimulus are scaled relative to 2019 GDP. From this perspective, the U.S. has committed roughly 9.1% of 2019 GDP to fiscal measures, while Germany’s measures are equivalent to roughly 13.3%. The German government had left themselves the fiscal room to respond aggressively to a crisis. The implied debt ratios would grow to 96.8% for the U.S. and 82.1% from the Germans, leaving German authorities in a superior position relative to where the U.S. was before the crisis.viii
In the U.S., federal spending rose to more than US$1.1 trillion in June, more than twice what the government spends in a typical month.ix The amount of tax revenue collected by the federal government remained largely flat, at about US$240 billion, in part because the Treasury Department delayed the tax filing deadline until July.x The huge surge in June pushed the budget deficit for the first nine months of the fiscal year to US$2.7 trillion. For the twelve months to June, the deficit has hit $3 trillion or 14% of GDP. The U.S. budget deficit widened to US$864 billion (about $1.1 trillion) in June, a stark jump from $8 billion in June 2019, almost matching the entire gap for the prior fiscal year ($984 billion).xi
U.S. GDP recovered some lost ground in May and June but renewed outbreaks over recent weeks make apparent that the recovery will not be a perfect V-shape. Without additional government stimulus, the recovery could be in jeopardy. Six U.S. banks have announced $35 billion in cuts to their profits. Government programs are temporarily propping up consumers and businesses. The biggest banks are planning on bad loans. JPMorgan, Citigroup and Wells Fargo set aside almost $28 billion in the second quarter; a mark only surpassed by the last three months of 2008. All three lenders said their economic outlook had deteriorated as the coronavirus rages unchecked across America. Congressional bailout money has only delayed the debt tsunami Wall Street sees coming.
Germany is responsible for 29% of the euro area GDP and is the economic engine of the block. Fiscal authorities avoided crowding out investment to the private sector during the expansion and are now stepping in to provide needed capital to fuel the recovery. German consumers showed up in May as the economy re-opened, pushing nominal retail sales up 8.2% year-over-year, reflecting some pent-up demand.xii Surveys of economic activity in Germany suggest that it held up better between March and May than France, Italy or Spain. That may be because of its heavy reliance on manufacturing, where maintaining both output and a social distance is easier than, say, in retail or hospitality services. Capital Economics argues that Poland will experience Europe’s smallest contraction in GDP this year in part because it relies little on foreign tourists.
The Office for Budget Responsibility (OBR) has warned that the government’s UK debt/GDP ratio could balloon to more than 500% during the next fifty years in a “downside” scenario has barely caused a ripple in the Gilt market. In Britain, the OBR believes, borrowing, which was forecast to be 55 billion pounds (about $95 billion), could now hit 322 billion pounds (about $550 billion). That is the equivalent of over 16 per cent of GDP, the highest for any year since the Second World War, and the deficit and debt could be higher if the economy performs worse than expected.
Country Fiscal Measures in Response to the COVID-19 Pandemic (Percent of GDP)
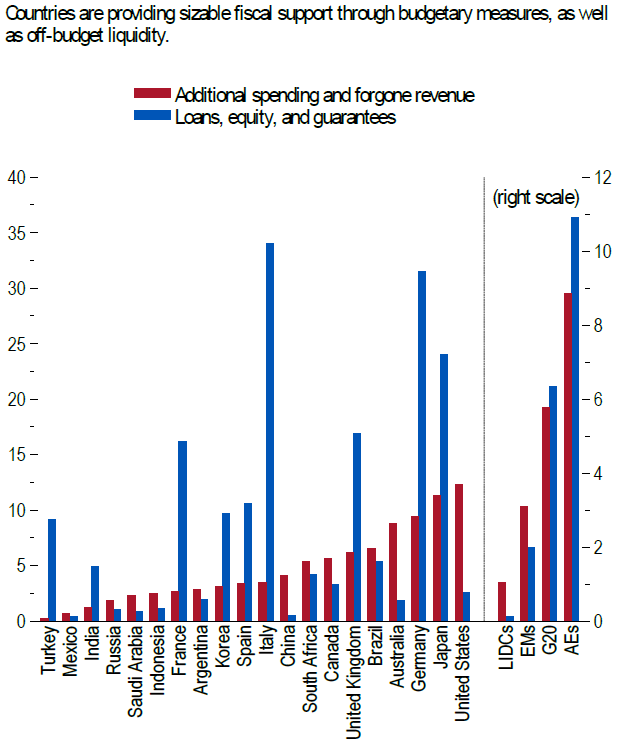
SOURCE: IMF JUNE 2020 WORLD ECONOMIC OUTLOOK UPDATE
NOTE: (DATA SOURCE: NATIONAL AUTHORITIES; AND IMF STAFF ESTIMATES.) DATA ARE AS OF JUNE 12, 2020. COUNTRY GROUPS ARE WEIGHTED BY GDP IN PURCHASING POWER PARITY-ADJUSTED CURRENT US DOLLARS. REVENUE AND SPENDING MEASURES EXCLUDE DEFERRED TAXES AND ADVANCE PAYMENTS. AES = ADVANCED ECONOMIES; EMS = EMERGING MARKETS; G20 = GROUP OF TWENTY ECONOMIES; LIDCS = LOW-INCOME DEVELOPING COUNTRIES.
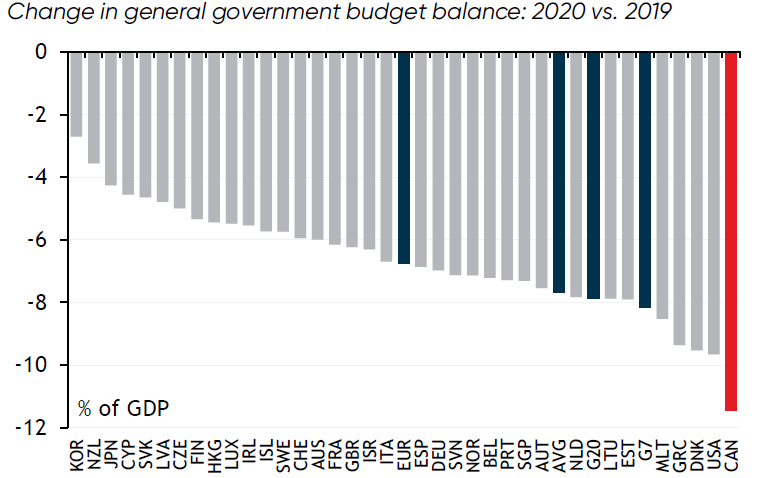
Change in Global Government Debt and Overall Fiscal Balance (Percent of GDP)
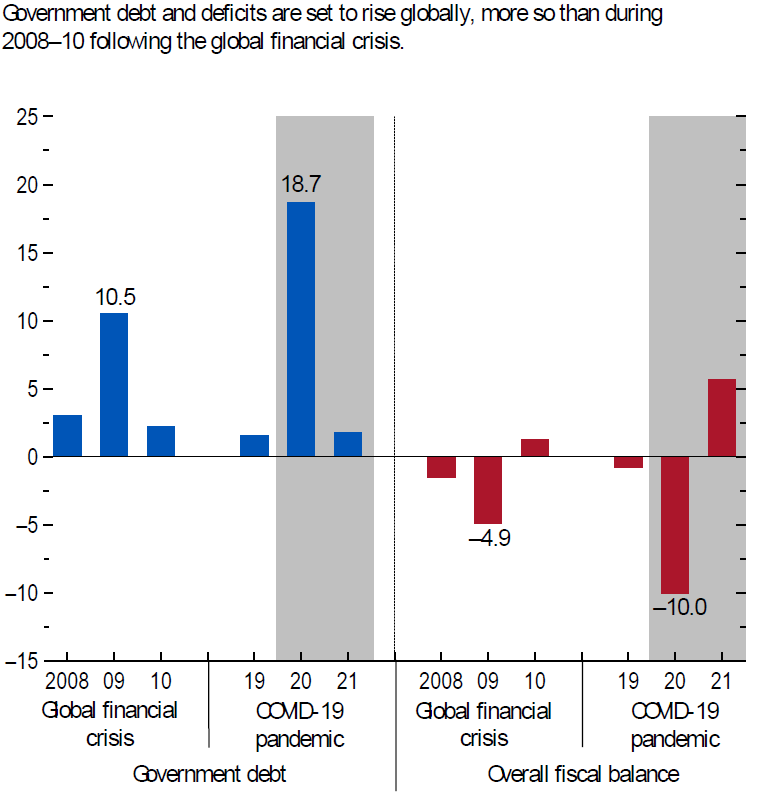
SOURCE: IMF JUNE 2020 WORLD ECONOMIC OUTLOOK UPDATE (IMF STAFF ESTIMATES.)
Frame Global Asset Management uses macro-economic analysis in order to develop a twelve-month forward view of where the global economy is heading. We factor this outlook into our Portfolio Model creation, combined with a view to minimize losses. As we advance through the current Covid-19 pandemic, we focus on the facts that we can rely on and adjust our forward views accordingly.
In addition to the unknowns at this time with regard to the COVID-19 pandemic, we understand that maintaining open supply lines globally will allow for access to medical products and food. Restricting trade and disrupting established supply chains will hinder the ramp up of the manufacture of much-needed protective equipment, testing kits, ventilators, and other essentials. In the longer run, a turn towards protectionism will slow down the global economic recovery, to the detriment of all countries, most damagingly for the poorest.
We are living a recession that was made worse by overextended private and public sector balance sheets hanging over from the last expansion. Current debt will hang over future growth, even once we are past this health crisis. The depth will depend on two main factors: how long it takes to bring the pandemic under control, and the policies governments implement, domestically and at the international level in order to mitigate the pandemic’s economic consequences.
The economic, social, and financial fallout from the Covid-19 pandemic will almost certainly continue for a prolonged period. It is impossible to predict the exact course that financial markets will take as the pandemic continues.
Governments, rather than having to resort to austerity, default, or inflating debt away, will need to demonstrate to financial markets that they will return debt to a sustainable path.
As we enter the back half of 2020, we identify the following risks:
• Secular stagnation – This refers to a rise in the amount of desired saving relative to desired investment, which has prompted interest rates to fall to balance the two. This in turn reflects various factors such as the impact on saving of ageing populations, shareholders’ desire for short-term returns and a dearth of investment opportunities.
• A flare-up in trade tensions with China
• More delays on the re-openings
• The second-quarter earnings season – Key will be guidance, especially since the market is expecting the numbers to turn positive by Q4
• The November U.S. election
• A U.S. fiscal cliff
International Monetary Fund Risks Noted
As is the case everywhere, there is uncertainty around the IMF 2020 forecast. Their forecast sights the depth of the contraction in the second quarter of 2020 as well as the magnitude and persistence of the adverse shock. These elements, in turn, depend on several uncertain factors including:
• The length of the pandemic and required lockdowns
• Voluntary social distancing, which will affect spending
• Displaced workers’ ability to secure employment, possibly in different sectors
• Scarring from firm closures and unemployed workers exiting the workforce, which may make it more difficult for activity to bounce back once the pandemic fades
• The impact of changes to strengthen workplace safety—such as staggered work shifts, enhanced hygiene and cleaning between shifts, new workplace practices relating to proximity of personnel on production lines—which incur business costs
• Global supply chain reconfigurations that affect productivity as companies try to enhance their resilience to supply disruptions. The extent of cross-border spillovers from weaker external demand as well as funding shortfalls
• Eventual resolution of the current disconnects between asset valuations and prospects for economic activity
Section 2. Four Themes
Theme 1: The Global Economy is in Recession
According to Yelp, nearly 66,000 businesses have shut their doors since March 1st and the rate of closures is on an upswing into mid-July. Researchers at Harvard estimate the number of business closures is closer to 110,000 nationwide, which makes sense since we already know that the run-up in permanent job losses since the crisis began has totaled an epic 1.6 million.xiii Erratic economic data has driven volatility. Italian industrial production, which just came out for May, soared 42.1% month-over-month, while the year-over-year pace was -20.3%. France saw a 19.6% industrial production pop in May and a year-over-year trend hitting -23.4%. Taiwan’s exports fell last month for a fourth straight month and officials there warned that global demand is going to struggle to recover with the latest outbreak of the coronavirus (adding the heightened tensions between the U.S. and China as another roadblock).xiv
We expect import declines as a GDP offset when inventories go down as this was the case in the U.S. as inbound goods shipments from abroad fell back 1.2% in May. What was most concerning from a capital spending intention standpoint was the 1.9% pullback in capital goods imports, which compounded the 10.7% plunge in April that left the three-month number with a decline of -31.9% at an annual pace.xv
The even bigger problem was the export figure — sliding 5.8% after big declines in April (-25.1%) and March (-7.4%). The numbers are so staggering that the three-month trend has collapsed to an -81.7% annual rate. The entire foreign sector has been hit. And the pullback in business investment plans in the context of eroding profit growth, a complete lack of visibility, and preservation of cash on the balance sheet, has gone global because U.S. exports of capital goods sunk 2.5% in May after a 23.8% decline in April, taking the three-month trend to a -75.3% annual rate.xvi The implications of this for future productivity at a time when labor force participation rates enter a period of secular decline is a severe challenge to the world potential GDP growth rate. This is one reason why deflation today will point morph into stagflation once demand stabilizes. This environment of nil or negative growth accompanied by inflation is a very difficult one to emerge from.
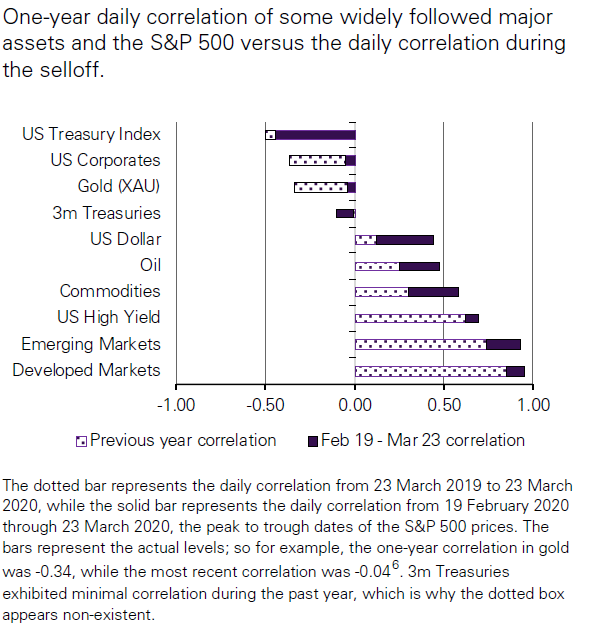
Theme 2: Gold is a Safe Haven: Central Banks Agree
Gold performed strongly in the first half of 2020, increasing by 16.8% in US dollar terms and outperforming all other major asset classes. Gold breached the $1800-mark for the first time since 2011. The World Gold Council reports a record of nearly $40 billion flooded into gold-backed ETFs in the first half of the year. Though equity markets around the world rebounded sharply from their Q1 lows, the high level of uncertainty surrounding the COVID-19 pandemic, the massive wave of central bank stimulus, and the ultra-low interest rate environment prompted a flight into the safe haven.
Fundamental drivers of the gold price are the low yield environment, substantial fiscal and monetary stimulus, and the inflationary impact on asset prices.
In the current global economic environment, three drivers are supportive of investment demand for gold:
• high risk and uncertainty
• low opportunity cost
• positive price momentum.
Traditionally, assets such as U.S. Treasuries and G-10 sovereign bonds comprise the bulk of central bank reserve portfolios. Gold is also held as it tends to outperform other assets during periods of market stress.
The case for central banks holding gold remains strong, especially considering the economic uncertainty caused by the COVID-19 pandemic. This was supported by the findings in the recently published 2020 Central Bank Survey, Gold Trends Report, World Gold Council. Factors related to the economic environment, such as negative interest rates, were overwhelming drivers of these planned purchases. This is supported by gold’s role as a safe haven in times of crisis, as well as its lack of default risk. Our view remains that central banks will remain net purchasers in 2020.
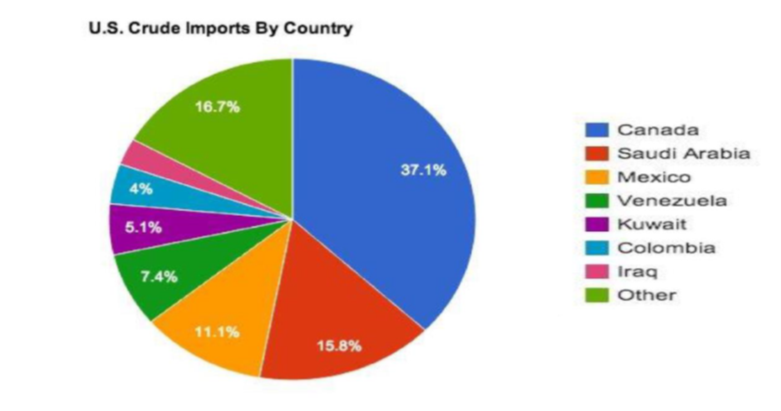
Theme 3: Oil Prices: Geopolitics Meets the Pandemic
The oil market experienced sharp decreases in the first quarter of 2020 as it was inundated with low-cost oil after Saudi Arabia launched a price war with Russia. The two countries put an end to the dispute in April by agreeing to reduce production by nearly 10 million barrels per day to stimulate markets. But prices continued to plummet when it became clear that the promised reductions would not be enough to offset the collapse in demand that has been exacerbated by the pandemic. The coronavirus pandemic caused oil demand to drop so rapidly that on April 20th, U.S. oil to be delivered in May settled at -$37.60 per barrel, the first negative close in history. Producers, who were running out of storage space as demand for energy collapsed, were willing to pay buyers to take crude off their hands. The effects of cheap crude infiltrated the global economy.
The double black swan has caused oil prices to collapse to levels that make it impossible for U.S. shale oil companies to make money. In a $20 oil environment, 533 U.S. oil exploration and production companies would be expected to file for bankruptcy by the end of 2021, according to Rystad Energy. At $10, there would be more than 1,100 bankruptcies, Rystad estimates. Rystad’s $20 scenario predicts more than $70 billion of oil company debt will get reorganized in bankruptcy, followed by $177 billion in 2021. That accounts for exploration and production companies but not the servicing industry that provides the tools and manpower to drillers.xvii
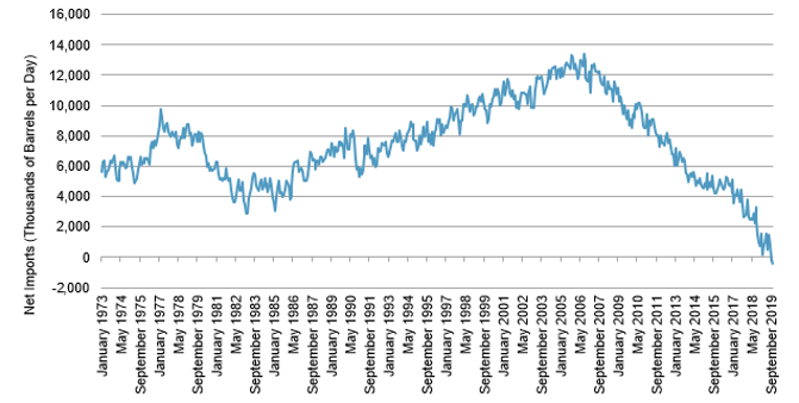
In a June Oil Market Report, the International Energy Association predicted that for the year 2020, demand for oil will drop by 8.1 million barrels per day, the biggest-ever decline. Changes in lifestyle and reduced commuting in developed economies are expected to result in a permanent reduction in oil demand.
Theme 4: Global Currency Revaluation
The reductions in interest rates across Group-of-10 countries in response to the pandemic-induced halt to their economies has left most currencies yielding close to zero on a nominal basis.
The dollar, an important symbol of America’s global standing, remains the primary currency of choice for investors who use it to trade a wide array of assets around the globe. It is also the world’s top reserve currency, held in large quantities by governments, central banks, and other major financial institutions. The dollar benefits from being the currency of choice for many global transactions, including the trading of commodities like oil. It accounts for 62% of the world’s currency reserves and is involved in 88% of all global currency trades.xviii When the coronavirus became a global pandemic in March, there was a move to snap up US dollars, the world’s ultimate safe haven asset. After an extended stretch of gains, the US dollar lost ground in June as safe-haven demand for US dollars declined.
Investors are becoming less positive about the dollar’s outlook. Growing debt loads and commitment to “America First” policies have added to risks. A worsening economic outlook in the United States and a diminished role on the world stage could encourage allies to look to other top currencies. Research now supports the idea that an “America First” philosophy could hurt the dollar in the long run. A working paper published by the National Bureau of Economic Research in 2017 found that foreign demand for dollars could decline if the country was no longer seen as guaranteeing the security of its allies, leading them to hold more of their reserves in euros, yen and renminbi.xix Russia and China are increasingly avoiding the dollar when settling crude oil deals. After the United States pulled out of the Iran nuclear agreement, top EU officials began lobbying for greater use of the euro. According to a JP Morgan report by John Normand and Federico Manicardi, the risk of currency debasement may heighten next year and will show in the value of Japanese yen or gold rather than the dollar.
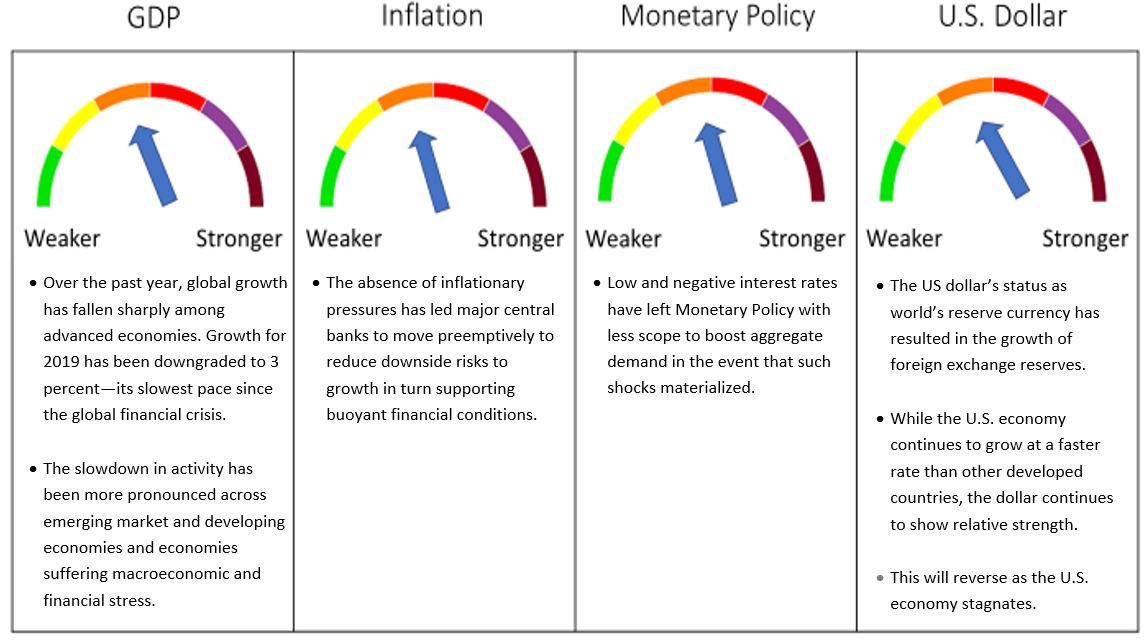
Section 3: Investment Outlook
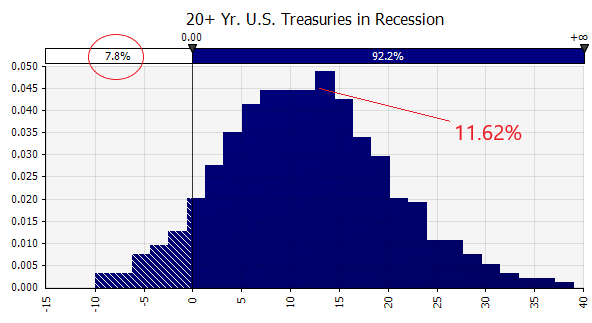
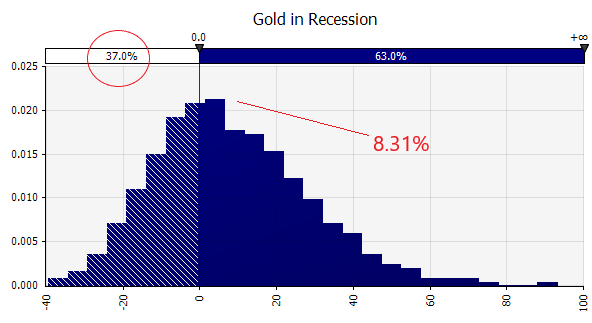
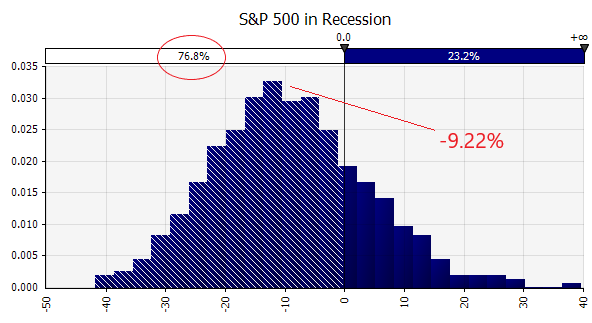
Global Pandemic Leads Us to a Recession Forecast for the Next Twelve Months
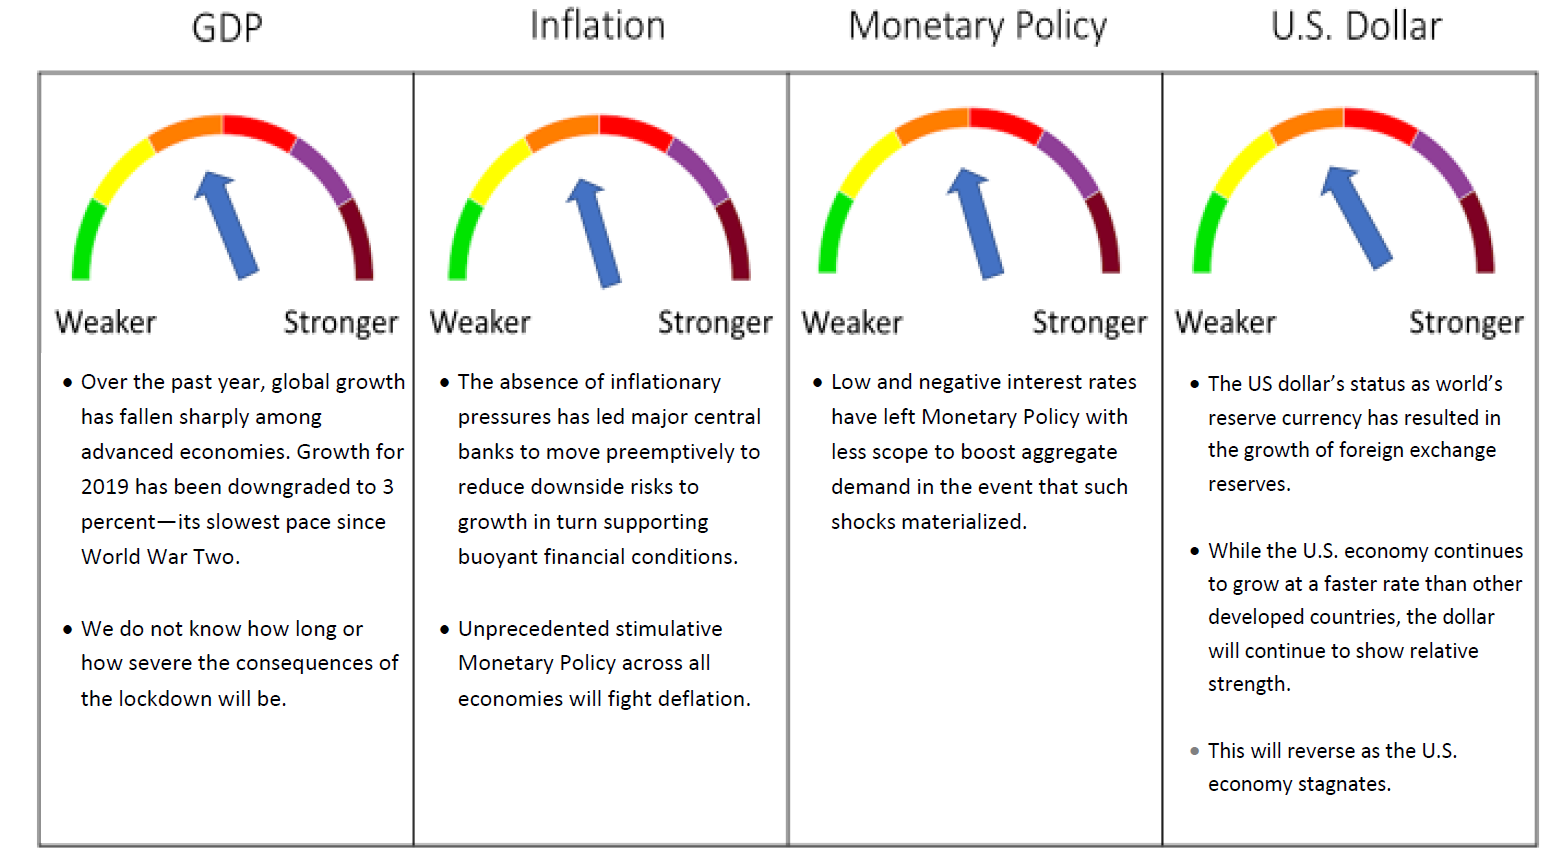
SOURCE: FRAME GLOBAL ASSET MANAGEMENT
Frame Global Asset Management considers these trends and factors them into our outlook for the economy in our twelve-month forward period. We look back to periods of similar economic behavior and use this information to predict the future behavior of the asset classes that we consider. Our investment process allows us to adapt for non-traditional monetary policy and other exogenous variables.
Section 4: June 2020 Portfolio Models
The role of the financial industry as an allocator and distributor of capital to the economy will be paramount to the evolution of the current pandemic. The current health crisis has morphed into an economic crisis, which has morphed into a financial crisis. While advances in testing and contact tracing will help, risk of a second wave of infections and the re-imposition of strict containment measures is likely to remain until a vaccine is developed. Simultaneously, geopolitical risks are heating up amid escalating tensions over Hong Kong, civil unrest in the U.S., and the return of Brexit uncertainty. We are monitoring these developments and have maintained our previous Recession Outlook for the U.S. economy to reflect a Recession that began in March and extends through the end of the year.
In June, we maintained the asset allocation that was established in May for all portfolio models. We continue to be positioned in shorter duration fixed income. We expect interest rates to remain low or negative across the globe and as a result, we continue to have exposure to gold which is a store of value in this environment and a preferred asset for central banks for the foreseeable future. Equity exposure to large cap across all models reflects our view that shifting business models during this pandemic have had a negative impact on bottom lines but that select businesses are benefiting from the shift.
Deborah Frame, CFA, MBA
President and Chief Investment Officer
July 14, 2020
iIMF. World Economic Forum. June 2020.
iiIMF. World Economic Forum. June 2020.
iiiIMF. World Economic Forum. June 2020.
ivTrading Economics. Country Interest Rates. June 2020.
vU.K. Government. Treasury Loans. July 16, 2020.
viTrading Economics. Country Lists, Credit Ratings. June 2020.
viiOECD. Corporate Debt to Equity Ratios. June 2020.
viiiChristie, Rebecca. EU Opportunity. The Bruegel Think Tank. July 16, 2020.
ixTrading Economics. U.S. Government Spending. June 2020.
xWorld Bank. U.S. Federal Tax Revenue. July 2020.
xiTrading Economics. U.S. Federal Government Budget. June 2020.
xiiTrading Economics. Germany Retail Sales. July 1, 2020.
xiiiNational Bureau of Economic Research. How Are Small Businesses Adjusting to COVID-19? NBER Working Paper 26989. April 2020.
xivTrading Economics. Country Economic Data. June 2020.
xvTrading Economics. U.S. Imports of Capital Goods. May 2020.
xviTrading Economics. U.S. Exports of Capital Goods. May 2020.
xviiRystad Energy. COVID-19 Report. 14th Edition. July 3, 2020.
xviiiWorld Gold Council. July 2020.
xixNational Bureau of Economic Research. Foreign Safe Asset Demand and the Dollar Exchange Rate. NBER Working Paper 24439. Issued March 2018. Revised March 2019.