Section 1: Q4 2020 Outlook
Teetering Between Recovery and Chaos
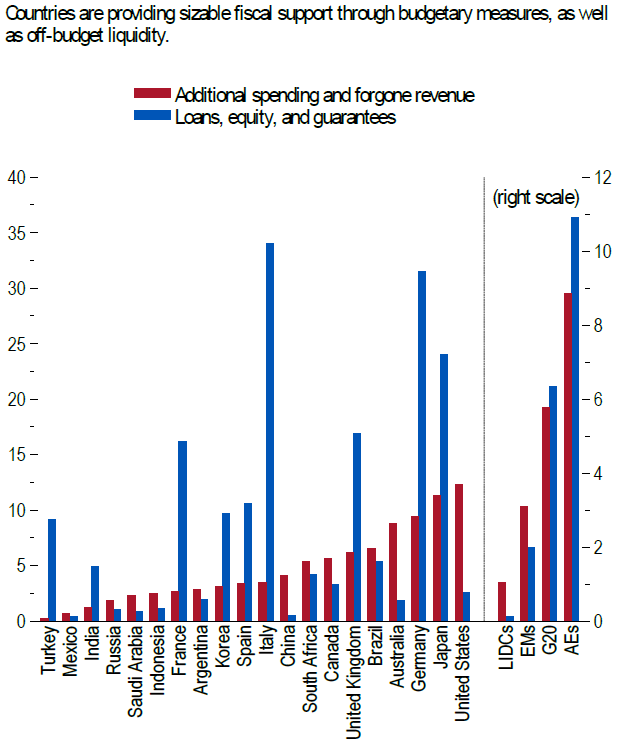
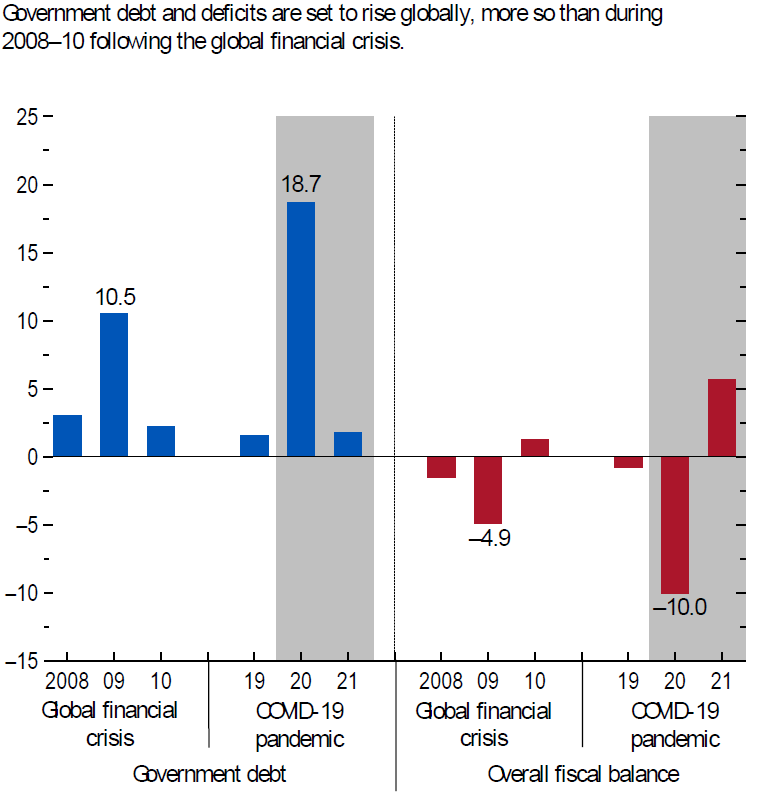
COVID-19 has depressed economic activity around the world. Monetary and fiscal responses from governments and central banks in both developed and emerging economies since March are without precedent, far surpassing actions taken during the global financial crisis.
We are currently living in a world that is teetering between recovery and chaos. As a Portfolio Manager, our job is to offer you solutions that provide your investments with the best protection through our portfolio models, addressing the current uncertainty and acknowledging the new economic regime that is the outcome of this global event.
Containing the virus’ spread is the best way to save the economy and investment markets. Policies that allow economic activity to proceed safely, without placing people at undue health risk are needed. The global economy cannot recover until the epidemic is under control. This will happen when efforts to provide relief to individuals and businesses complement efforts to control the spread of the virus.
These are unprecedented times. Investors want to minimize volatility and losses. Traditional investment management that focus on broad diversification among asset classes and relative over and under weights to a broad array of asset classes have experienced losses. The Frame Global Asset Management investment process addresses the global movement of capital into and out of the U.S. and incorporates a forward-looking view of where capital is heading in this changing world.
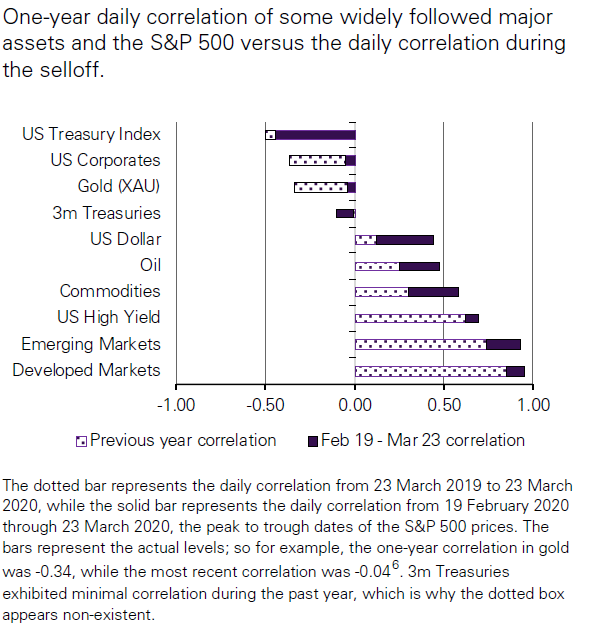
We know that there is a direct link between macroeconomic and geopolitical uncertainty and volatility and correlations within markets and asset classes. We also know that capital around the world moves to markets where it sees the greatest opportunity. This is largely driven by relative interest rates, currency differentials, and perceived safety/risk. Common sources of macro risk – including the Fed, energy prices, geopolitics, inflation shocks, regulatory change, sovereign risk, elections, and fiscal-policy dysfunction – can affect both single stock volatility within an asset class and the correlation among stocks and bonds.
The chaos of the economic collapse during this pandemic has obscured the initial impact of global central bank actions. Emergency programs have come while nominal interest rates are low by historical standards. As a result, monetary policy will be constrained in its ability to provide further support to a recovery. Aside from rate cuts, central banks have also begun to increase the money supply via a sweeping Quantitative Easing program. But the conditions for QE to stimulate demand are less favorable now than they were in 2008–2014. This is because the current recession combines a shock to demand with a shock to supply. As supply chains are broken and workers cannot report to their jobs, many firms are not be able to increase output and would not be able to even if the demand returned.
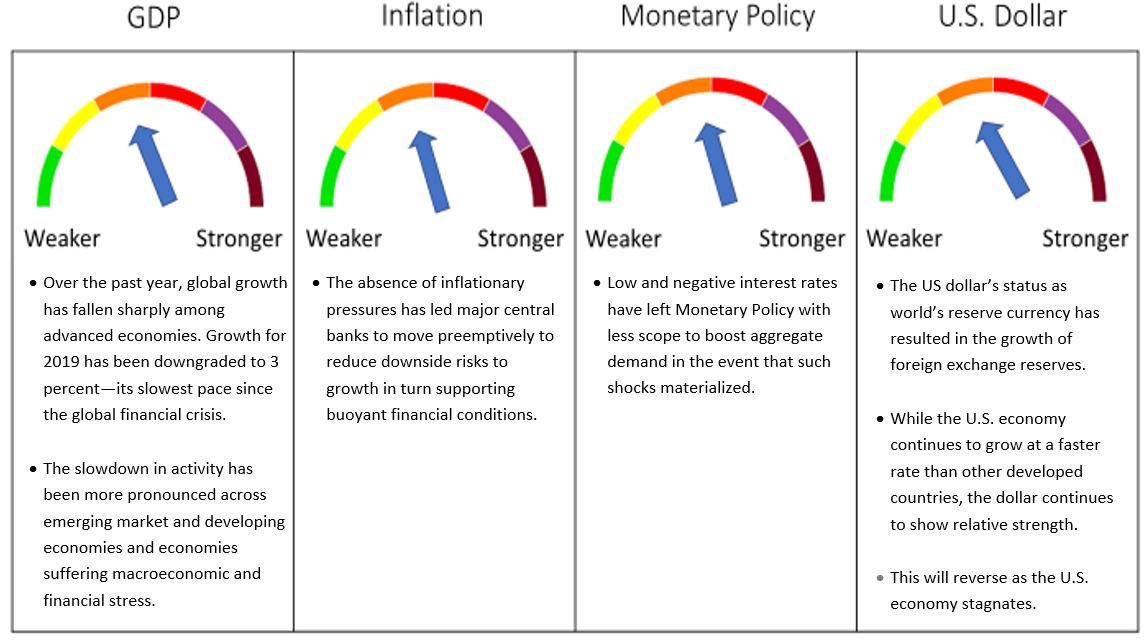
The State of the Global Economy
In the face of large budget deficits, a stock market bubble, and the impact of plummeting oil prices from last year, the state of the global economy was less than ideal heading into 2020.
One of the rare benefits of crises and recessions is that they remove both unproductive firms and financial excess, creating space for more productive firms and fresh financial investment. This did not happen after the Recession of 2008, resulting in a weak economic recovery from the crisis that varied in economies around the world. In dealing with the Great Financial Crisis (GFC) of 2008, the U.S. recapitalized, merged, and permitted the failure of some banks, but Europe chose the opposite approach resulting in undercapitalized and ailing banks surviving.
However, the most impactful mistakes were made after the GFC on both sides of the Atlantic. For the past decade, central banks have enacted zero or negative interest rate policies and sought to manage economic downturns through policies of quantitative easing (QE). Such programs were adopted in Japan, the European Union, and United States, each with varying degrees of success. Intermediary banks paid the sellers of bonds (households, funds, banks, etc.) and the Fed compensated the banks with reserves. In practice, the Fed forced excess reserves onto the balance sheets of banks far beyond levels they would have acquired independently. Because of the higher supply of reserves system-wide, their marginal benefit decreased, bidding up the prices of various securities. This led the banks to issue additional and often riskier loans until the balance of the marginal benefits was restored. Also, because Quantitative Easing and low policy rates depressed long-term rates, many of the securities that the commercial banks held had no yield advantage over reserves, making the banks more likely to substitute less-liquid securities with more credit risk.
More than ten years later, through FX reserves and through QE programs, central banks globally hold government bonds issued by a relatively small number of advanced economies. Meanwhile, growth in the wake of the 2008 financial crisis slowed and the U.S. economy began to show signs of recession heading into 2020.
The Monetary Policy Challenge and the Unintended Consequences of Quantitative Easing
From its initial detection in Wuhan, China to the outbreak’s late-February global explosion, the early 2020 onset of the novel coronavirus (COVID-19) pandemic brought chaos to financial markets worldwide.
During the immediate aftermath of COVID-19 reaching pandemic proportions, led by the U.S Federal Reserve (FED), central banks around the globe fought massive uncertainty and took action to restore pricing stability. In an attempt to mitigate the negative economic implications of the coronavirus, a new policy of unlimited quantitative easing was implemented.
The experience of using QE through the past decade has made us aware of a number of unintended consequences. As quantitative easing lowers long-term interest rates, a low-cost financing environment can lead to excessive speculative behavior, which will lead to rapid expansion of debt and add to the market risks. In addition, quantitative easing can lead to excessive issue of cash and push up asset prices, creating bubbles. Globally, quantitative easing is likely to generate more debt and market risks in other countries, especially for emerging economies. If the United States attempts to withdraw easing policies in the future, emerging markets might experience currency devaluation and a fall in the stock market, given the current influx of large amounts of capital to emerging market countries. And although unlimited quantitative easing may lead to a quick economic recovery in the short term, it ignores the urgency of long-term and deep-seated structural problems in the U.S. and other economies.
A New Wave of Disinflation
One of the concerns raised about QE that has not proven to be threatening in this pandemic is inflation. To glean insights into the possible economic consequences of Covid-19, a Federal Reserve Bank of San Francisco working paper examined the medium- and long-term effects of 15 pandemics, ranging from the Black Death in the 14th century to the 2009 H1N1 outbreak.i
Response of the European Real Natural Rate of Interest Following Pandemics and Wars
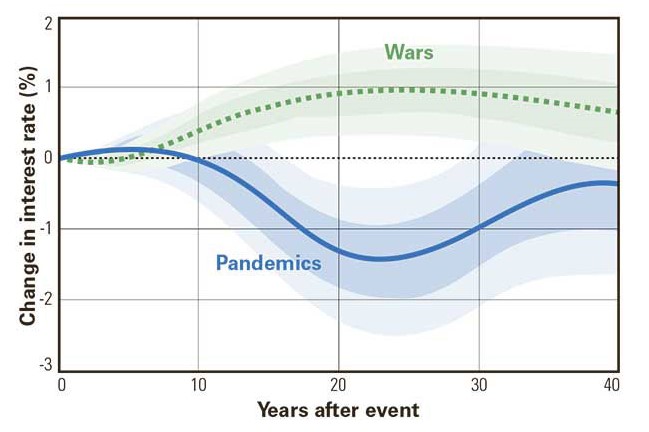
SOURCE: ÒSCAR JORDÀ, SANJAY R. SINGH, ALAN M. TAYLOR. 2020. “LONGER-RUN ECONOMIC CONSEQUENCES OF PANDEMICS,” FEDERAL RESERVE BANK OF SAN FRANCISCO, WORKING PAPER 2020-09. VIA MARK YAMADA ON ADVISOR’S EDGE.
The figure above shows how the natural rate of interest responded after the pandemics ended (defined as a smoothed risk-free rate plus a high-quality bond return premium). The figure shows pandemics have been deflationary for decades following the event, while wars have been inflationary. Recessions are usually deflationary because low output and low demand temper prices.
Risk Appetite
The distinction between Pandemics and wars comes down to risk appetite. The reality is that we are in uncharted territory and the future is very much dependent upon how the public health crisis evolves. Until risk appetite recovers, disinflationary pressures will prevail. Inflation may come back into focus to the extent that supply is constrained, because of layoffs and the lag time required to re-hire and re-train. Demand could return because of income replacement from unemployment insurance and other government relief measures. These could be exacerbated by the type and timing of additional relief measures.
Fiscal policy has a necessary role in this recovery. In the U.S. it is the responsibility of Congress and the White House, not the Fed. At this point Congress needs to start deploying all its fiscal tools. The proposed $2 trillion package of loans to businesses and cash for households is not guaranteed to bring a swift, V-shaped recovery. The CARES Act is not stimulus, it is relief. Essentially, it is income and cash flow replacement. It is bridge financing, not outright stimulus. The federal government is attempting to create a bridge over a crisis that has caused incomes for individuals and businesses to disappear because of behavioral changes and rolling lockdowns to flatten the infection curve. Stimulus depends on how funds are administered. Businesses are unlikely to invest in capital spending without greater certainty and/or tax incentives. Consumers will be cautious until personal safety and employment certainty are evident, so stimulus may be muted. As a result, post-pandemic deflation is likely.
At the end of the day, this all comes down to risk appetite. Capital reserves are endogenous – a closed system. They cannot be and are not lent out. They always stay within the fed funds system. Secondly, banks create credit – not the Fed. Lastly, credit is a function of risk appetite. What does this all mean for inflation? QE and increasing excess reserves are not inflationary unless there is demand for credit, which is driven by risk appetite. Unless there is risk appetite to borrow and banks have risk appetite to lend, then reserves just sit there as excess reserves.
Until risk appetite recovers, disinflationary pressures likely prevail. With that said, we are in uncharted territory and the future is very much path dependent upon how the public health crisis evolves. As we have come to learn through this crisis, almost anything is possible, but inflation fears should be of little worry at the moment.
The Price of Saving the Economy
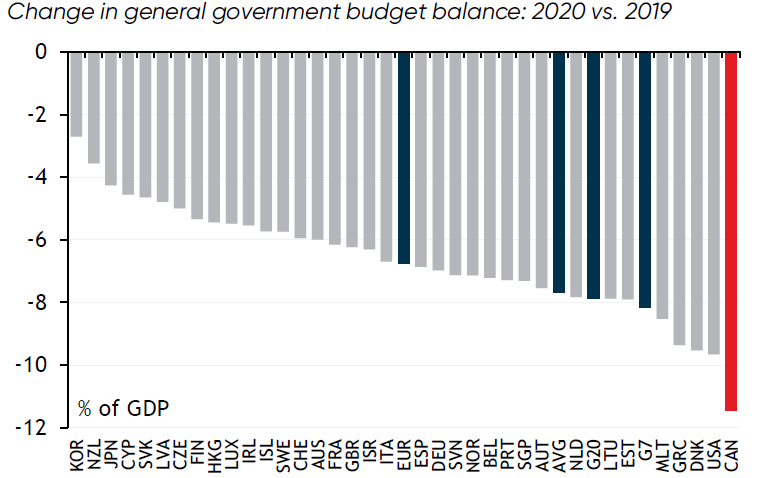
The federal budget deficit has soared to a record $3.1 trillion in the 2020 fiscal year, as the coronavirus pandemic fueled enormous government spending while tax receipts plunged as households and businesses struggled with economic shutdowns.ii
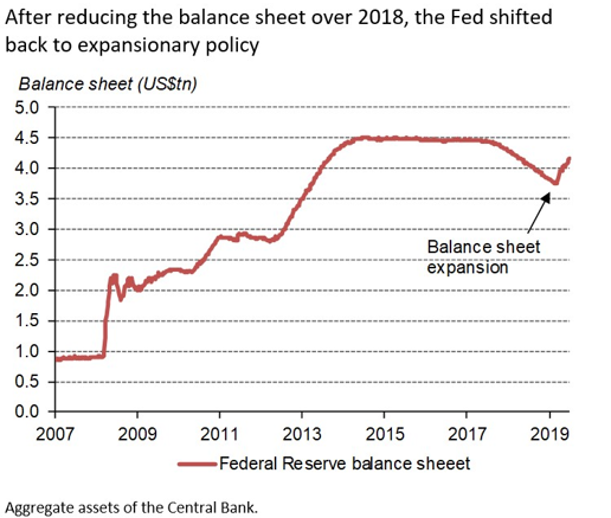
The Fed has increased the size of its footprint in the economy by more than two-thirds and proved to investors that it would step in to buy entirely new kinds of assets.
The gap between what the U.S. spends and what it earns through tax receipts and other revenue is now $2 trillion more than what the White House budget forecast in February. It is also three times as large as the $984 billion deficit in the 2019 fiscal year.iii
The shortfall underscores the long-term economic challenge facing the United States as it tries to emerge from the sharpest downturn since the Great Depression. Interest rates are low, meaning it costs less for the government to borrow money, although the ballooning deficit is complicating policy choices as Republicans resist another large stimulus package, citing concerns about the U.S. debt burden.
This massive deficit is the result of two Fed policies. First, when panic struck financial markets in March, Fed officials lowered the target for their benchmark rate to a range of zero to 0.25%, where they say it will likely remain for years. They have consistently ruled out pushing rates into negative territory. Second, large-scale bond repurchases, interbank loans, corporate loans and currency swaps were executed. In late 2019, nominal interest rates from the overnight to a 10-year maturity averaged between 1.5 and 2 percent. On March 3, 2020, the Federal Open Market Committee reduced the Federal Funds Target Rate by ½ point to 1.00%-1.25% in an emergency policy move. Two weeks later, on March 15th, the FED elected to drop the Federal Funds Target Rate to 0.0%-0.25% to calm the markets. The Fed currently purchases about $120 billion a month combined in Treasuries and mortgage-backed bonds. The damage of the COVID-19 recession will be magnified by the Federal Reserve’s inability to cut interest rates further, leading it to undertake massive additional asset purchases. As the Fed continues to push further into different corners of the economy, it is making it more difficult to get out at some point.iv
History shows that the Fed’s interventions in the name of crisis management are very difficult to withdraw from once a crisis is over. The actions it took from 2008 to 2010, presented as temporary, remain largely in place.
Michael Kiley, a senior Fed economist and deputy director of the bank’s financial stability division, has forecast that bond purchases equal to 30% of U.S. economic output (about $6.5 trillion) will be required to offset the impact of the Fed’s benchmark rate already being nearly zero. The Fed has so far purchased bonds through so-called open-market operations and emergency lending facilities equal to about $3 trillion since March, implying that another $3.5 trillion is needed, to make up for the monetary policy handicap of zero rates.
Globally, QE by central banks in 2021 is expected to more than double the previous peak in 2010 after the financial crisis. Quantitative easing in Central and Eastern Europe has aided coronavirus crisis responses but risks would be more pronounced if QE undermined perceptions of central bank independence and economic policy framework credibility according to Fitch Ratings.v
Since the Onset of this Stress Event, We Have Demonstrated that Our Investment Approach is Successful
Traditional investment managers are handicapped when their portfolios are “macroeconomic regime” agnostic. The Frame Global Asset Management investment process monitors the global movement of capital into and out of the United States. Markets are forward looking, and when we look at the behavior of markets, we see that they eventually reflect the reality of the current and anticipated future macroenvironment. We make extensive use of our internal expertise in interpreting economic data. We exploit these inefficiencies and provide our clients with superior outcomes. We focus on minimizing capital losses by recognizing macro and geopolitical risks that are present and expected over our forecast time horizon
In July, we maintained the asset allocation that was established in June for all models. We continued to be positioned in shorter duration fixed income. We expected interest rates to remain low or negative across the globe and as a result, we continued to have exposure to gold which is a store of value in this environment and a preferred asset for central banks for the foreseeable future. Equity exposure to large cap across all models reflects our view that shifting business models during this pandemic have had a negative impact on bottom lines but that select businesses are benefiting from the shift. We are continuing to monitor the recovery in Europe following the Eurozone’s agreement on a stimulus package. Within FX, we are monitoring the US dollar, which tends to perform inversely with global growth. Independent shocks to risk including politics and the outcome of the U.S. election in November could affect dollar performance over the back half of 2020.
In August, we maintained the asset allocation that was established in July for all models. We continued to be positioned in shorter duration fixed income. We expected interest rates to remain low or negative across the globe and as a result, we maintained exposure to gold while monitoring four variables: the US dollar, stock market volatility, real interest rates, and inflation. We continued monitoring the recovery in Europe following the Eurozone’s agreement on a stimulus package.
In September, we maintained the asset allocation that was established in August for all models. We continued to be positioned in shorter duration fixed income due to larger-than-average duration supply from the Fed. Lower rates mean lower income as inflation is positively correlated to yields. With interest rates low or negative, we have maintained exposure to gold. The U.S., as the largest democracy in the world, is still seen as the safest place to invest. The Bank’s monetary policy objective is to deliver price stability and, subject to that, to support the Government’s economic objectives including those for growth and employment. Monetary stability means stable prices and confidence in the currency. A reflection of this stability has been evidenced through most of history as capital flows to the U.S. from abroad for opportunity and to escape other relatively riskier international environments.
Economic Regime Based Investing
Unfortunately, a multitude of variables persist regarding the containment and eradication of the COVID-19 contagion. Until the U.S. addresses the long-term structural problems of its economy, ranging from an aging population, to inadequate welfare policies, worsening income inequality, low productivity, insufficient investment in the real economy, and long-term fiscal and foreign trade deficits, it is entirely plausible that the Fed will be struggling a decade from now to undo the emergency actions of today. It is very likely that a new economic regime is underway. Our investment approach allows us to anticipate and adapt to a change like this.
Section 2. Four Themes
Theme 1: The November U.S. Election
While the course of the pandemic is by far the biggest risk to our forecasts over the next year or two, the November 3rd elections have the potential to leave a wide-ranging and long-lasting impact on the economic outlook. The chaotic handling of the pandemic together with Trump’s response to widespread protests in American cities have helped Biden open a wide early lead in the national polls. A Joe Biden victory in November together with Democrats winning back control of the Senate could see a big increase in taxation and federal spending, together with a shakeup of healthcare, regulatory, and trade policy. Uncertainty is exacerbated by the impact of voting during a global pandemic on turnout models and potential operational issues including an increase in voting by mail.
Of more importance is the makeup of Congress, with a clean sweep of the House, Senate, and the Presidency enabling either party to loosen fiscal policy more markedly.
Trump & Biden’s Positions on the Key Issues
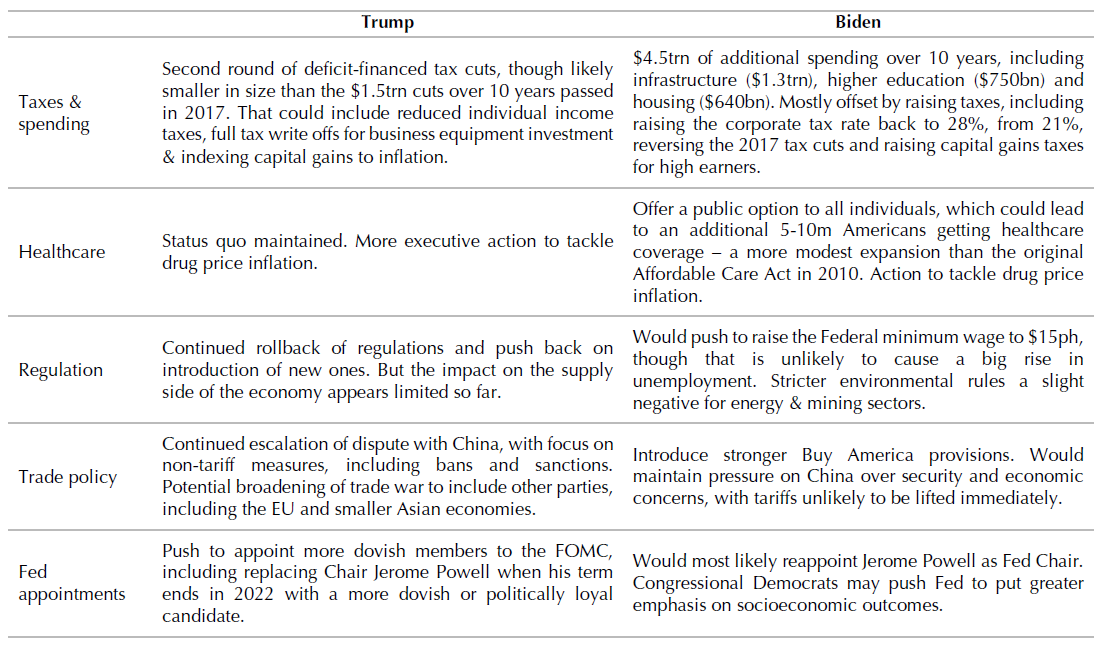
SOURCE: CAPITAL ECONOMICS
Theme 2: Secular Stagnation
The Pandemic is exacerbating secular stagnation that was already present before 2020. This refers to a rise in the amount of desired saving relative to desired investment, which has prompted interest rates to fall to balance the two. This in turn reflects various factors such as the impact on saving of ageing populations, shareholders’ desire for short-term returns, and a dearth of investment opportunities.
We anticipate rest-of-world GDP will finish this year nearly 5% below pre crisis levels as virus containment and macroeconomic policy are not being managed effectively. Recent policy developments have reinforced concerns on this front. Although treatment has improved and mortality rates have decreased, COVID-19 has not been contained and new cases globally have moved back to their mid-year high. At the same time, there is no evidence that fiscal policy is moving to offset the run-off in emergency stimulus.
Theme 3: A Flare-Up in Trade Tensions with China
The results of the phase one trade deal between China and the United States and the trade war that preceded it have significantly hurt the American economy without solving the underlying economic concerns that the trade war was meant to resolve. Six months after the deal was inked, the costs and benefits of this agreement are coming into clearer focus. The effects of the trade war go beyond economics. President Trump’s prioritization on the trade deal and de-prioritization of all other dimensions of the relationship produced a more permissive environment for China to advance its interests abroad and oppress its own people at home, secure in the knowledge that American responses would be muted by a president who was reluctant to risk losing the deal.
Theme 4: Forecast Uncertainty
The International Monetary Fund has noted several risks around their 2020 forecast.
The forecast sights the depth of the contraction in the second quarter of 2020 as well as the magnitude and persistence of the adverse shock. These elements, in turn, depend on several uncertain factors including:
• The length of the pandemic and required lockdowns
• Voluntary social distancing, which will affect spending
• Displaced workers’ ability to secure employment, possibly in different sectors
• Scarring from firm closures and unemployed workers exiting the workforce, which may make it more difficult for activity to bounce back once the pandemic fades
• The impact of changes to strengthen workplace safety—such as staggered work shifts, enhanced hygiene and cleaning between shifts, new workplace practices relating to proximity of personnel on production lines—which incur business costs
• Global supply chain reconfigurations that affect productivity as companies try to enhance their resilience to supply disruptions
•The extent of cross-border spillovers from weaker external demand as well as funding shortfalls
• Eventual resolution of the current disconnects between asset valuations and prospects for economic activity
Section 3. Investment Outlook
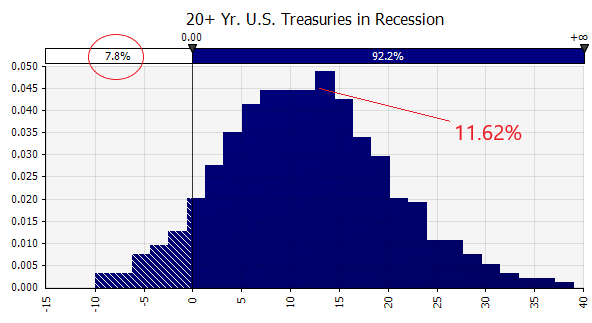
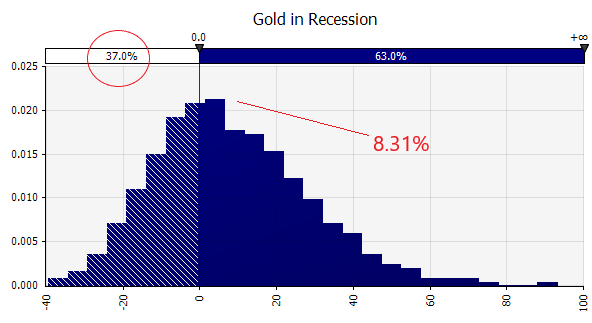
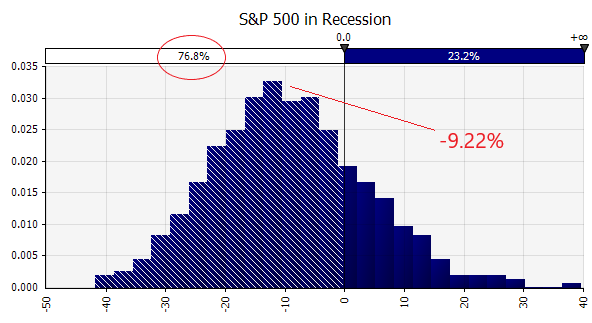
Global Pandemic Leads Us to a Recession Forecast for the Next Twelve Months
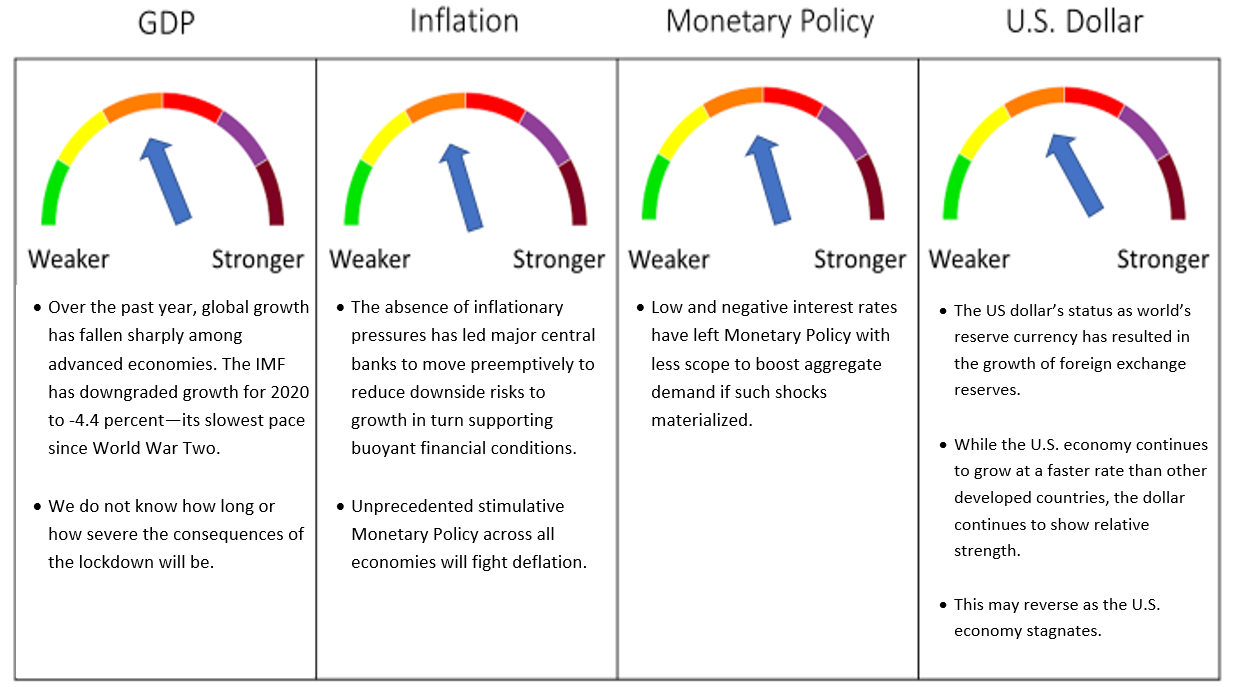
SOURCE: FRAME GLOBAL ASSET MANAGEMENT
Frame Global Asset Management considers these trends and factors them into our outlook for the economy in our twelve-month forward period. We look back to periods of similar economic behavior and use this information to predict the future behavior of the asset classes that we consider. Our investment process allows us to adapt for non-traditional monetary policy and other exogenous variables.
Section 4. September 2020 Portfolio Models
The global pandemic-induced GDP collapse has led to higher debt service burdens and lower ability to repay, resulting in an increase in non-performing loans and credit risk. We are now in a twilight zone of partial lockdowns. Fearful of rebellion, and of snuffing out signs of economic recovery, governments are opting for a hodge-podge of curbs. Financial intermediaries have become more risk averse, slowing the flow of much-needed new credit and debt. These signs of cooling are consistent with our view to maintaining our Recession Outlook for our forecast horizon of the next twelve months. Our outlook depends on what happens with fiscal policy and the spread of COVID-19, and we will continue to closely monitor these.
In September, we maintained the asset allocation that was established in August for all models. We continue to be positioned in shorter duration fixed income due to larger-than-average duration supply from the Fed. Lower rates mean lower income as inflation is positively correlated to yields. With interest rates low or negative, we have maintained exposure to gold. Equity exposure to large cap across all models reflects our view that shifting business models during this pandemic have had a negative impact on bottom lines but that select businesses are benefiting from the shift. We are continuing to monitor the recovery in Europe following the Eurozone’s agreement on a stimulus package.
Deborah Frame, CFA, MBA
President and Chief Investment Officer
October 14, 2020
iFederal Reserve Bank of San Francisco. Longer-Run Economic Consequences of Pandemics. June 2020.
iiTrading Economics. U.S. Government Budget. October 16, 2020.
iiiTrading Economics. U.S. Government Budget. October 16, 2020.
ivFederal Reserve. FOMC Statement. September 16, 2020.
vFitch Ratings London. June 3, 2020.